
In late May of 2012 I organised and delivered a week long workshop on Information Visualisation for UbiComp Data, as part of the UbiOulu summer school. On a scale from worst (1) to best (5) my workshop was scored 4.35 on average by 14 of the 23 participants from the workshop who responded to a survey request, so there is room for improvement. This blog post covers the background to the workshop, the schedule, the results of a survey and some discussion.
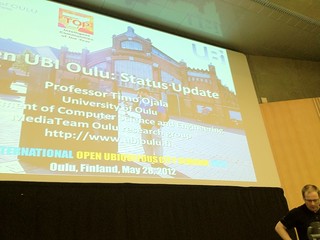 |
| Professor Timo Ojala opening the UbiOulu Summer School 2012 |
Background to the workshop
I was invited by Professor Timo Ojala to run this workshop eight months before travelling to Oulu in Finland. Even with the time to prepare, it remained a slightly daunting task which worried me (as such things often do!). There were 23 graduate students from around Europe attending to learn about Infovis. When you consider they were collectively devoting half a person year to something, you want to make sure you make it worth their while! I have taught modules, courses and guest lectured about InfoVis on four different continents at this stage in my career. In addition I was a director of the Online Dublin Computer Science Summer School (ODCSSS) for four years which had over 80 interns through the process. I also organised the SICSA MMI Summer School on Multimodal Systems for Digital Tourism in St Andrews in June of 2011 with over twenty students and a dozen lecturers. None the less, this was the first time I had tackled this type of theory and practice experience.
Thankfully as all educators do, I was able to get advice from my colleagues. In SACHI, Dr. Miguel Nacenta provided some very useful advice and helped moderate some of my slightly more "ambitious" ideas. Dr Adrian Friday from the University of Lancaster was an instructor at the UbiOulu summer school in 2011 and was able to offer me invaluable advice (and healthy warnings about the social aspects of the program). Thanks also to Jean-Daniel Fekete from Inria and Professor Sheelagh Carpendale from Calgary who offered good advice on their experiences with such events. Thanks to all these folks and to the many authors whose work I drew on in covering InfoVis for UbiComp data. This preparation and consultation paid off, as on a scale from worst (1) to best (5) the "content" of the workshop was scored 4.42 on average by 14 of the 23 participants from the workshop who responded to the survey request. The style and delivery of the my workshop was rated as 4.53 by 13 participants.
Thankfully as all educators do, I was able to get advice from my colleagues. In SACHI, Dr. Miguel Nacenta provided some very useful advice and helped moderate some of my slightly more "ambitious" ideas. Dr Adrian Friday from the University of Lancaster was an instructor at the UbiOulu summer school in 2011 and was able to offer me invaluable advice (and healthy warnings about the social aspects of the program). Thanks also to Jean-Daniel Fekete from Inria and Professor Sheelagh Carpendale from Calgary who offered good advice on their experiences with such events. Thanks to all these folks and to the many authors whose work I drew on in covering InfoVis for UbiComp data. This preparation and consultation paid off, as on a scale from worst (1) to best (5) the "content" of the workshop was scored 4.42 on average by 14 of the 23 participants from the workshop who responded to the survey request. The style and delivery of the my workshop was rated as 4.53 by 13 participants.
 |
| Some of the possible directions Information Visualisation might take you. |
Schedule of workshop
For those interested in organising such a week long activity the schedule for the workshop was as follows:
1 Month before the workshop, 10 InfoVis papers from a range of areas.
Monday
9-12: 4th International Open Ubiquitous City Seminar (25 minute talks by instructors, Q&A with speaker panel)
12-13:30: Lunch break
13:30-14: Summer School kick off (auditorium)
14-16: Lecture: Setting the stage - 7 challenges with Visualising Ubiquitous Computing Data
18-24: Get Together Party
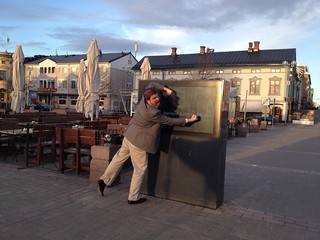 |
| Aaron testing the robustness of the UbiOulu displays during the UbiOulu Summer School |
Tuesday
10 - 12.00: Lecture: Setting the stage - 7 challenges with Visualising Ubiquitous Computing Data
12.00 - 13.15: Lecture - Infovis - Data Types
13.15 - 14.15: Lunch
14.15 - 15.00: Lecture - Infovis - Data Types
15.00 - 16:00 Project - Surveying own and UbiOulu data types
16.00 - 17.00: Lecture - InfoVis toolkits
17.00 - 18.00: Project: Problem Identification Workshop (Small group discussion)
Wednesday
10.00 - 10.30 Design proposal presentations from all groups and workshop D groups
10.30 - 11.30 Lecture - Information Visualisation - Graph Layout
11.30 - 11.00: Project: Design Proposal Generation - paper prototypes, sketches/mockups (Small group workshop)
13.00 - 14.00: Lunch
15.00 - 17.30: Project: System Decomposition, Co-Design and Task Planning (workshop)
With lecturer, per group, technical Review of Design Sketches (Group discussion)
17.30 - 18.00: FastFoot session - Presentation of prototype plans (presentations)
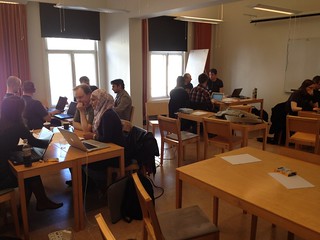 |
| Group work |
Thursday
10.00 - 13.00: Rapid Prototyping Session (team programming)
13.00 - 14.00: Lunch
14.00 - 15.00: Early Prototype Review and Feedback (group meetings with lecturer)
12.00 - 17.30: Rapid Prototyping Session (team programming)
17.30 - 18.00: FastFoot session - Presentation of prototypes (presentations)
Friday
10.00 - 13.00: Prototype Improvement Session (team programming)
13.00 - 14.00: Lunch
14.00 - 17.30: Prototyping and evaluation Session (teams)
17.30 - 18.00: FastFoot session - Presentation of prototypes (presentations)
Saturday
3hr exam
Final group presentations from all groups
Final social party, sauna, disco etc.
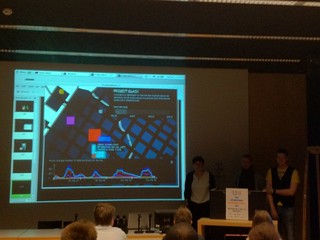 |
| Team Black presenting their final InfoVis for UbiComp data prototype |
Survey Results
Following the workshop, Professor Timo Ojala surveyed all the UbiOulu participants and provided these survey results to the three workshop organisers. In developing this review of the survey, I've picked out what I feel is an honest sample of the positives and negatives from the free-form feedback.
Some of the things the students liked the most, relating to me were "Expertise and attitude of the lecturer", "the energy from Aaron", "Great lecturer", "Really great guy and a great lecturer", "The lectures were top notch", "I like the style of Aaron how he presents things", "Aaron was very good at running the workshop" and "the skill of the professor". Of course, as any lecturer knows energy, engagement and motivation is a two way street, so my excitement and interest was largely fuelled by the motivation, dedication and hard work of the students. Those surveyed also commented that the workshop itself had, "thought out predefined groups", "interesting project work", "good balance between overview and in-depth information", "Really hands-on work and experience, I mean REALLY. Not just some crappy pre-made work, but a real problem to be solved", "hands on work was nice", "Workshop was challenging, and the things it taught are definitely going to be useful in the future", "how Aaron could take a seemingly complicated topic and make it easy to understand and enjoyable to sit through over three hours in an old classroom. The lectures were worth all the travel expenses alone!" and the "topic was as excellent as it was described in the school invitation".
Of course, there are things to improve, and I'm focussing my attention on these in planning for future InfoVis courses, modules or summer schools. Things to improve include, "deepening of formal models of graph theory", "data that was more ready to use", "show different levels of evaluation", "share some info regarding the tools needed in the workshop beforehand", "post workshop reading list", "More information of data parsing methods", "Some examples using the workshop specific data would've been nice", "data parsing methods would've been nice to discuss more about", "What do you think about having multiple smaller "discovery" projects using a better packaged data set and applying different visualisations to research some given research questions?", "I would definitely include one or two programming tutorials in the "reading package"", and "Oh, I did hate the exam, but that's no biggie".
The students surveyed had some very interesting things to say when asked, what was the most valuable thing you learned in your workshop. These included, "Visualisation techniques for the exploration of huge data sets", "How to think about information visualisation in a new way which I had never thought of before", "That information visualisation is not trivial and encompasses a lot of issues which are not immediately obvious to the lay person", "How to approach Info Vis, in particular the user centred design of the visualisation" and of course that "The focus of any visualisation is the user".
Discussion
I found the entire week and experience both refreshing, motivating and quite fun. Overall I was pleased with the structure of the workshop. There was enough time to cover some topics in detail, have some practical work, the local datasets were very useful, the fast foot sessions worked really well to have a clear daily focus for the teams, and the final session showed just want could be achieved. I'd like to improve the reading list, the approach to handling data, the upfront "pre-workshop" prep, the group matching and the availability of a "client" or "domain expert" for the data.
Going from the introduction to a topic to students delivering a prototype system 6 days later is very ambitious. When considering the majority of University teaching is delivered over the course of 3 months instead of 6 days it's worth reflecting on the long term benefit each approach offers. The short sharp delivery, is, by its very nature an introductory and high level view of the subject. The prototypes, are needfully simple and directed to identifiable problems. However, the entire period is devoted to a single topic, everyone has come from far and wide with different educational backgrounds to learn about InfoVis. This allows both the educator and learner to maintain a singular focus, in quite a supportive and high energy learning environment. This is supported by a fun social program (see below) where invaluable learning on the topic continues, sometimes into the wee hours of the morning! At this summer school everyone put their lives on hold to focus on just InfoVis of UbiComp data for 6 days. Those who came to learn about InfoVis received a broad introduction and some practical experience. Those looking to go deeper into the subject, did, I hope receive valuable direction and the confidence to explore the topic further in their own research.
For myself, I rediscovered how fun InfoVis can be, how incredibly powerful it can be, how messy real data is, how empowering unlocking data and information can be and how much a small, yet focussed group can achieve in a short amount of time. It also revived my interest in running an InfoVis summer school in Scotland supported by my local and international colleagues. There are many students and researchers across Scotland who might benefit from a week long summer school supported by SICSA. I look forward to developing this workshop further in the future.
I'm going to follow up this post with an overview of the papers I asked the students to read, the topics I covered, the three hour exam and some slides from the student projects. Below you can see me trying my hand as DJ during the final farewell party. In "modest brag" terms I did manage to fill the dance floor (albeit with crowd pleasing tunes), while I spent the time considering the usability of the multi-part digital-physical interface before me.